
Absolute limits to population growth V – introducing variation
Years in which horse populations are halved or growth reversed by extreme weather, are typical of longer-term studies. We should manage populations with the expectation that every 5 to 15 years there will be a bad year or two. We should evaluate estimates of population growth with the understanding that large variation in annual growth is typical – ‘shit happens’. Longer-term estimates of average annual population growth and how variable it is are more valuable.
Calculating maximum growth
First, we repeat the calculations (a) through (k) to find out what the largest population growth possible if all mares 2-years-old and older breed and there are no deaths. Change values of (a) and (b) until the value of (k) = 1. I have done this for you and the maximum values possible over several years because all mares breed is (a) 36.5 and (b) 1.365.
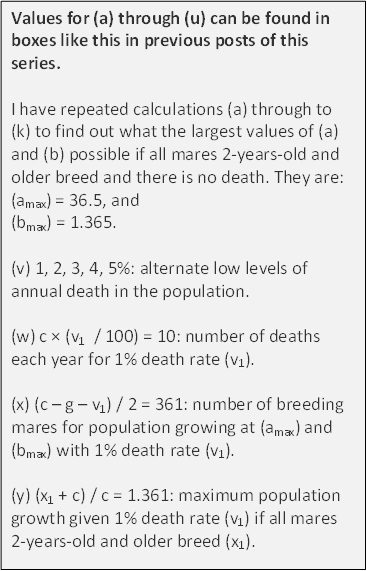 Then, we impose different death rates of 1 to 8% (v) on the maximally reproducing population. The higher the death rate, the lower the maximum annual growth rate. We calculate the number of deaths
 ![]() and the number of breeding mares left (x) for the eight different death rates, and use these to calculate maximum annual growth (y) where annual death rates range from 1 to 8%.
and the number of breeding mares left (x) for the eight different death rates, and use these to calculate maximum annual growth (y) where annual death rates range from 1 to 8%.
Average growth over a decade
I impose three, real-world scenarios on the population over a decade.
1. Growth is poor at 5.2% for one year – like Pryor Mountain’s population in 1983 [1] when the winter was bad enough to result in just a small increase in population size. The population multiplier (b)-poor (λ) is 1.052.
2. There is a catastrophic year and the population declined by 40% – like Pryor Mountains population in 1978 [1]. The population multiplier (b)-catastrophic (λ) is 0.593.
3. There was both a poor and catastrophic year during the decade, as there was during the 11-year, 1976-86, population record from Pryor Mountain [1].
Let the population increase at its maximum rate for the other years of the decade. We then calculate an average annual population growth over the 10 years for each scenario: nine values of the maximum growth (y) for each death rate (v) and the value for the poor or catastrophic year (z) for scenario 1 and 2, and eight values of maximum growth (y) for each death rate (v) and the value for the poor and catastrophic years (z) for scenario 3.
Seeing the answer
To simplify the answers I have constructed the graphic below. The graph compares average annual growth over a decade (vertical axis) for the three scenarios (1 poor year λ = 1.052, 1 catastrophic year λ = 0.593, and both a poor and catastrophic year) with the eight death rates (horizontal axis).
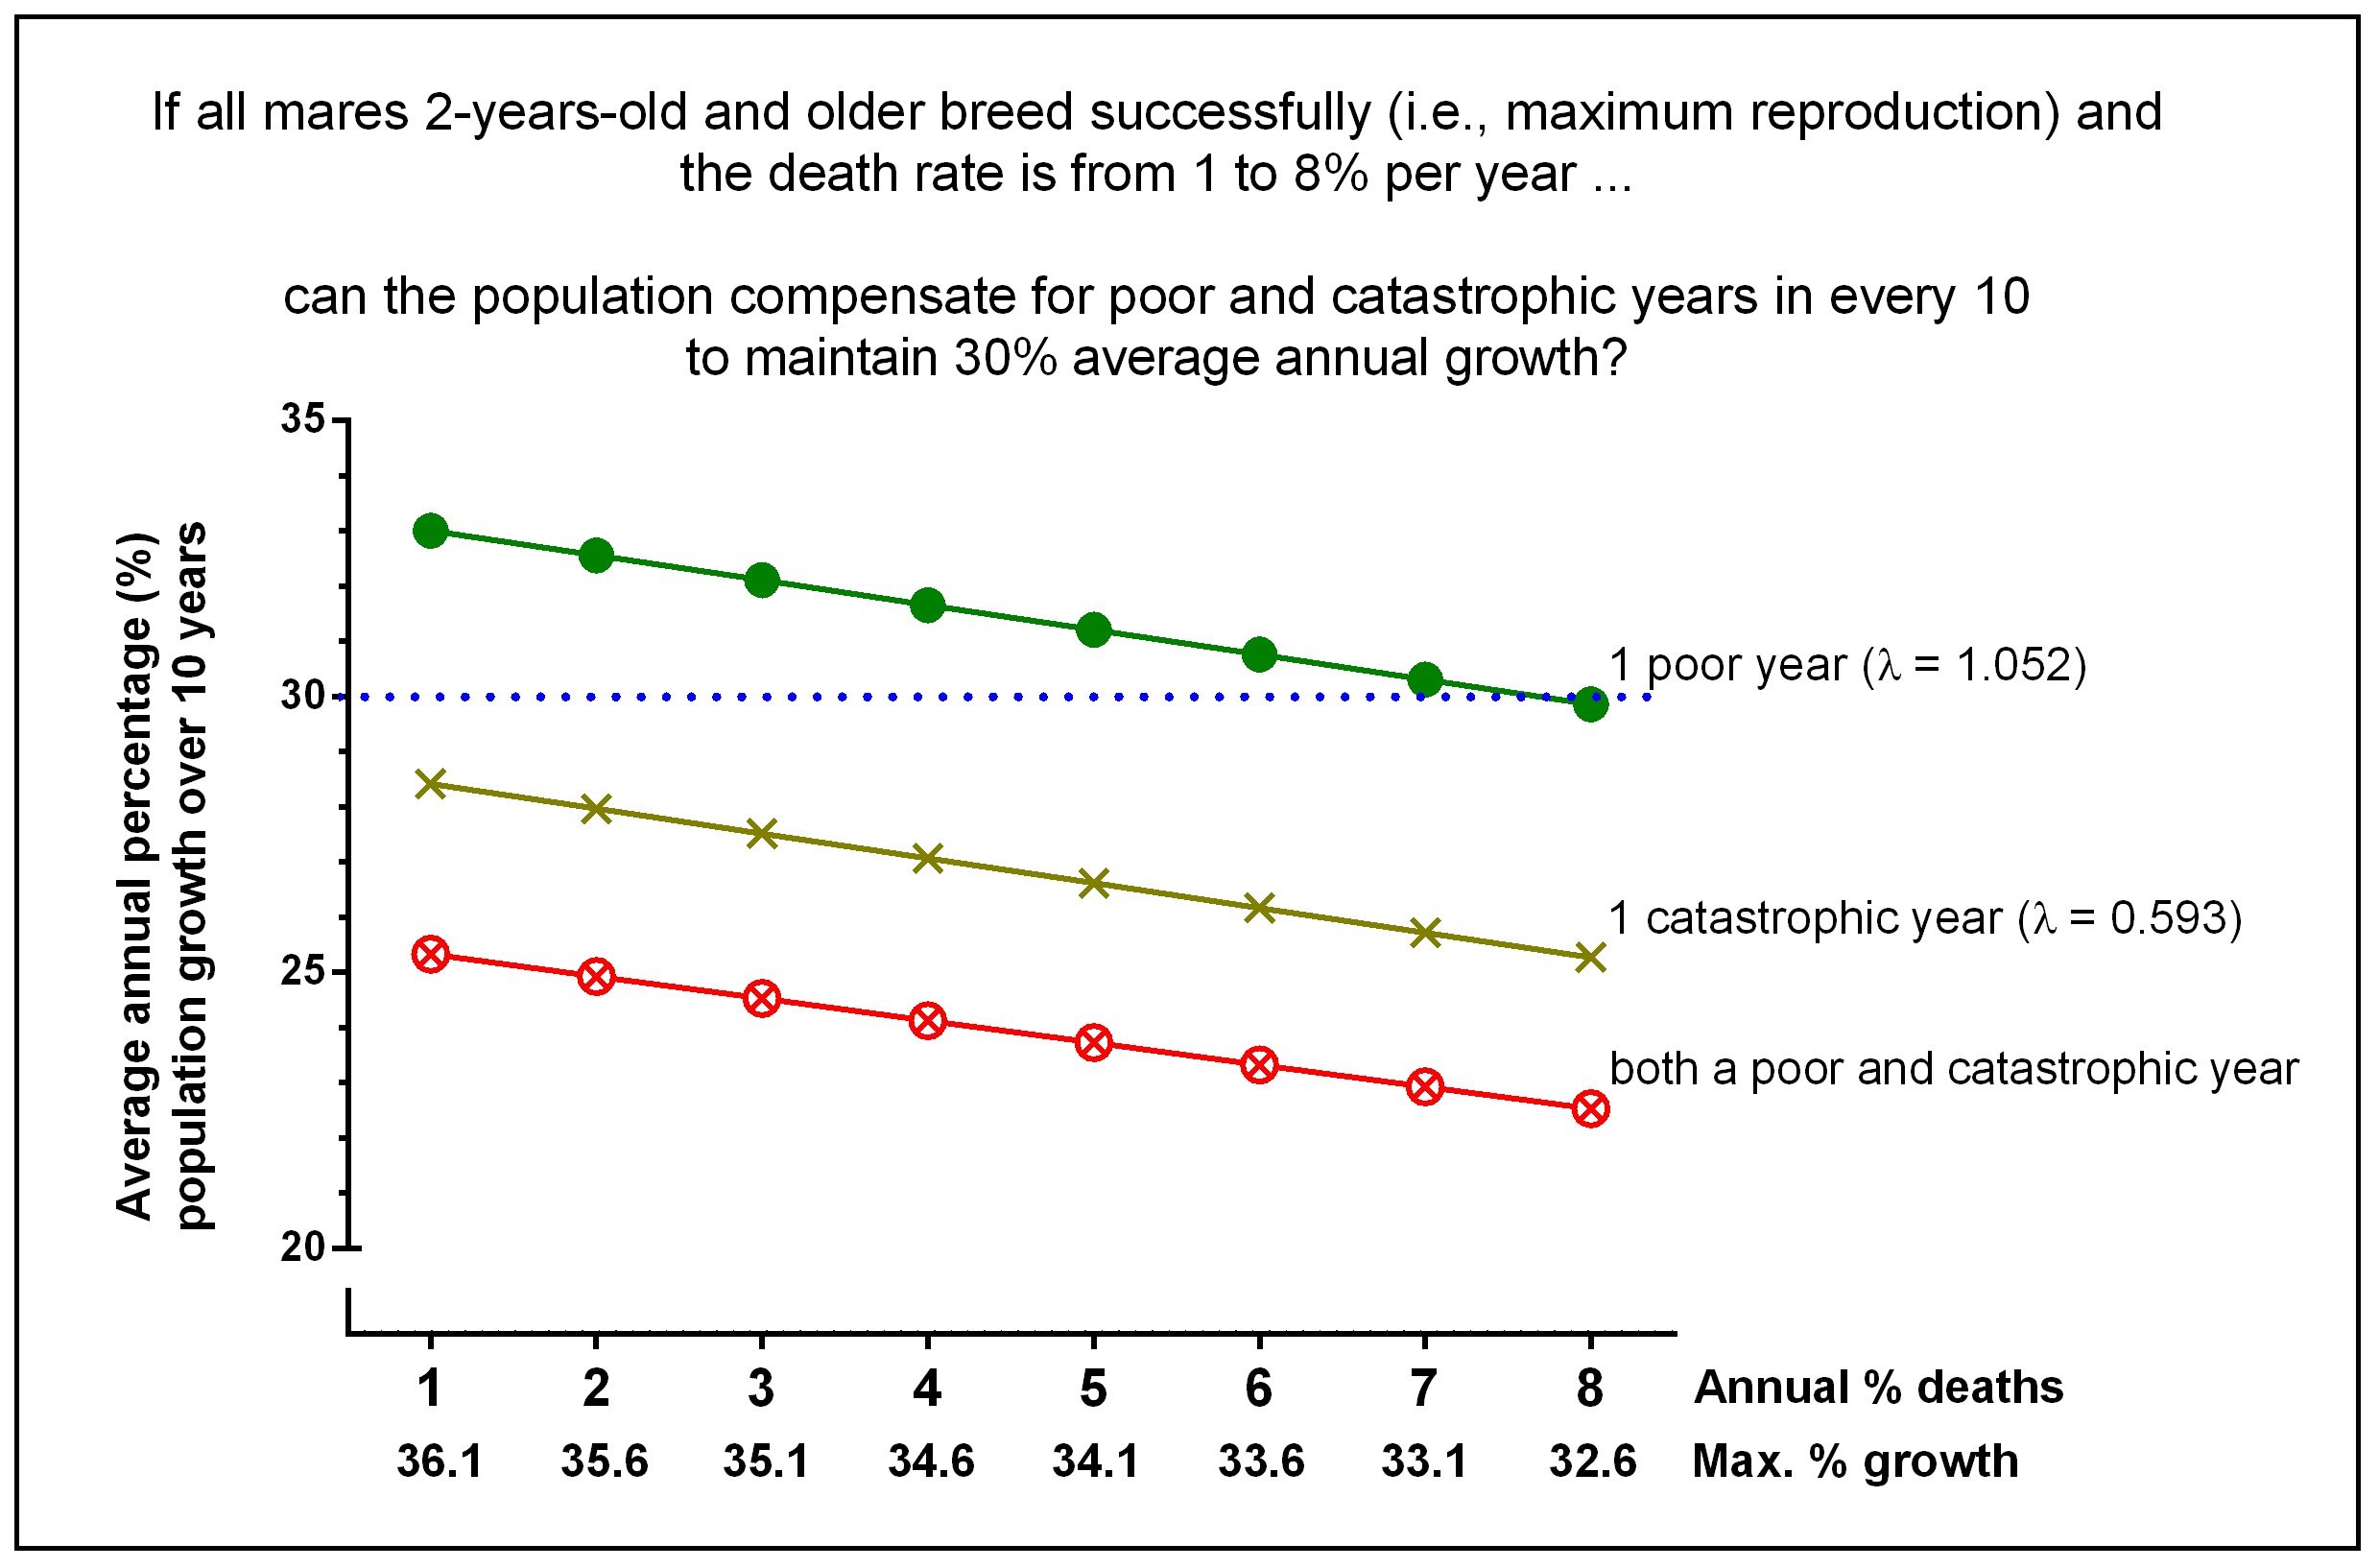 The answer is clear. A population cannot experience a catastrophic year, like 1978 at Pryor Mountain, and still achieve 30% annual growth over a decade – indicated by the blue dashed line in the graph – even if death rates during other years are as low as 1% and all mares 2-years-old and older breed successfully for the other nine years.
The third critique
So we have identified the third and last piece of information important to corroborate claims of extraordinary increases in population size – a measure of how variable growth rates are between years.
A measure of year-to-year variability will require that growth be measured across several years – the more the better. Ideally the study should exceed the length of a sites climatic cycle. A five year record is good but a record of 10 years or more is better.
Next time someone claims extraordinary population growth rate ask them “Over how many years did you measure growth and how variable was it from year to year?”. Average population growth rates around 30% per year are biologically impossible in places with large variation in conditions from year to year.

Mustangs in the Pryor Mountain Wild Horse Range. Source: http://www.8thingstodo.com
Nevertheless, the graphic also illustrates that where variation in population growth and death rates are low, high rates of population growth might be sustained so long as all mares breed successfully. How common are these conditions?
Unfortunately, long-term studies of 10 years, like that in the Pryor Mountain record [1], are rare. We might, however, gain some useful measures of maximum and variation in reproduction from shorter-term studies but at many different sites because they represent a large range of conditions.
I will insert greater realism into our calculations using other real-world values for reproduction and death…
… in my next post in this series.
Bibliography

Cool article, gracias!
Reblogged this on EQUILIBRE Gaiá and commented:
Another great article from Wayne Linklater on the variance found in population growth largely caused by extreme environmental conditions.
Pingback: Absolute limits to population growth VI – into the real world | Perissodactyla